Financial Technology (fintech) has seen a lot of venture capital funding over the past few years. How have its funding trends evolved over time? Through the insights derived from our fintech research platform, we conclude that the fintech sector is maturing.
We have come to this conclusion from the following four takeaways:
- Overall fintech funding trends are stable
- Fintech investor interest is constant
- Fintech funding has shifted to mid- and late-stage event
- The average fintech funding size is growing
We will illustrate these takeaways with a series of graphics to show that the sector is maturing.
Fintech Funding Relatively Stable in 2017
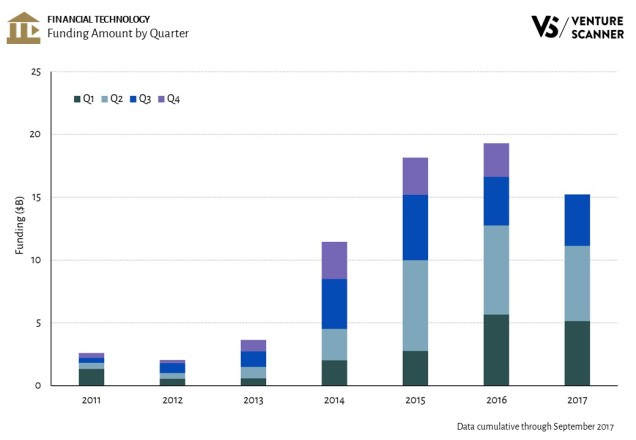
We will start off by examining the fintech funding trends over the years. Let’s look at the annual fintech funding amount stacked by quarter.

As we can see from the graphic, fintech funding in the first three quarters of 2017 is slightly down relative to 2016. In fact, it’s 92% of the funding in Q1-Q3 2016. Therefore we expect to finish off the year more or less on par with last year.
We have seen that funding trends are steady, but what about investor appetite?
Fintech Investor Interest Remains Constant in 2017
Let’s now look at the number of fintech investors who participated in each investment to see how investor activity has evolved over time.

The above graphic shows that fintech investor participation in the first three quarters of 2017 is slightly higher than 2016. It grew by 2% from the investor participation in Q1-Q3 2016. This implies the sector will end the year slightly up or flat year-over-year in fintech investor participation from 2016 to 2017.
We have seen that overall funding amounts and investor activity have remained generally flat, but what about the stages of investment?
Fintech Funding Shifted to Mid- and Late-Stage Events
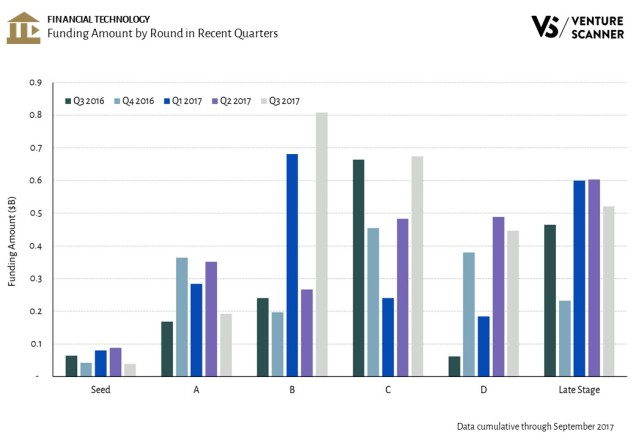
Let’s now take a deep dive and analyze fintech investors’ behavior in detail. Below are the Fintech Funding Amount by Round and Funding Event Count by Round graphics. The first graphic shows the total amount of funding that went into a specific funding round (such as Seed or Series A), while the second graphic shows the total number of funding events for a specific round.

The analysis above shows that Seed funding saw a 56% drop and Series A saw a 45% drop from Q2 2017 to Q3 2017. However, fintech funding amounts for later stage events grew from the previous quarter. Series B funding amount grew by 200% and Series C grew by 40%.
Based on the above, we can conclude that fintech funding has shifted from early-stage to mid- and late-stage funding. Let’s see if the Funding Event Count by Round graphic reinforces this conclusion.

We see that Seed and Series A rounds both saw a significant drop in funding events over the past quarter as well. Seed round events saw a 49% drop and Series A events saw a 25% drop from Q2 2017 to Q3 2017. In fact, the decline in Seed and Series A funding events appears to be a trend over the past few quarters.
On the other hand, Series B and later stage funding events have seen growth. Series B events grew by 82% and Series C events grew by 45% from Q2 2017 to Q3 2017.
The above data indicates that fintech investment has moved to later-stage ventures.
Fintech funding and investor activity have plateaued and the funding has shifted to mid- and late-stage. What about each individual investment deal size?
Average Fintech Funding Deal Size Growing in 2017
If the shift of fintech funding from early-stage to later-stage events indicates that the sector is maturing, we would also expect the average deal size to be growing. This is because as a sector matures, the winners would need larger capital infusions to scale.

This graphic does in fact indicate that the average fintech funding amounts have grown significantly over the past few years. The trendline shows that from Q3 2011 to Q3 2017 the average deal size has grown by approximately 700%. This consistent upward trend in average deal size indicates that the fintech sector is indeed maturing.
Conclusion: Fintech Sector Now Maturing
In summary, we’ve seen that the overall fintech funding and investor interest has remained steady. At the same time, the funding has shifted from early-stage events to later-stage events. Moreover, the average fintech funding amount has grown consistently year-over-year. These takeaways lead us to conclude that the fintech sector is indeed maturing. It’ll be interesting to see if this trend continues into 2018.
What are your thoughts on this? Let us know in the comments section below.
To learn more about our complete Financial Technology research platform, visit us at www.venturescanner.com or contact us at info@venturescanner.com.
Which areas of the FinTech space do you think are the most mature? And which do you think has the most opportunity for growth?