Where in the World Are Transportation Technology Startups? – Q3 2017

The analyses below summarize where Transportation Technology innovations are occurring. The graphic includes data through August 2017.
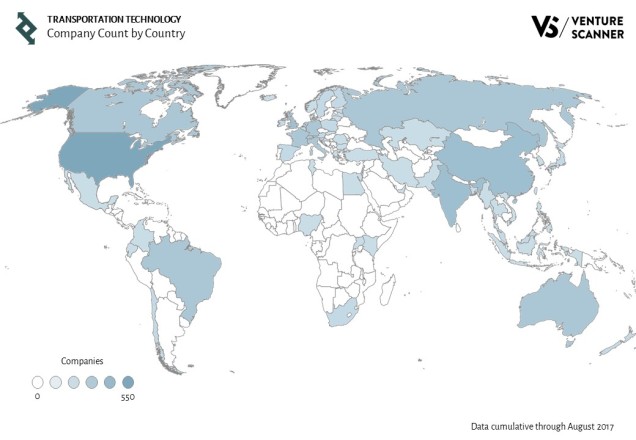
Transportation Technology Company Count by Country

The above map shows the number of Transportation Tech companies located in different countries. The United States ranks as the top country with around 550 companies.
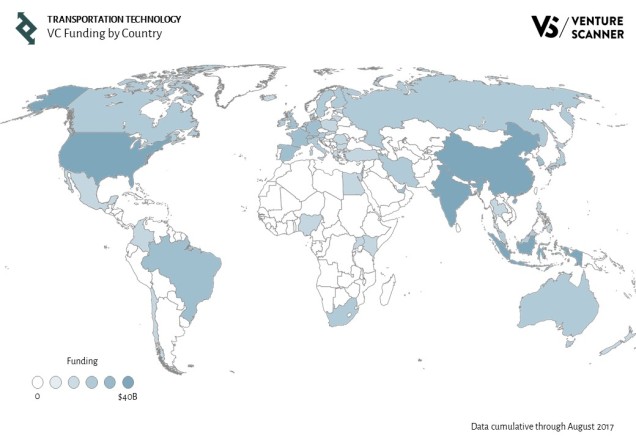
Transportation Technology VC Funding by Country

The above map shows the amount of total Transportation Tech startup venture capital funding in different countries. The United States has the most VC funding at around $40B.

We are currently tracking 1189 Transportation Technology companies in 17 categories across 66 countries, with a total of $94.9B in funding. Click here to learn more about the full Transportation Technology market report.
Age by Category in Transportation Technology – Q3 2017

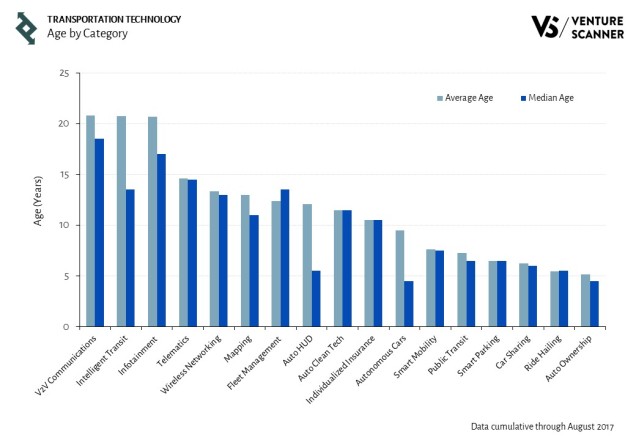
The following graph shows average and median age in the Transportation Technology sector. The graphic includes data through August 2017.

Transportation Technology Age by Category

The above graph summarizes the average age and median age of companies in each Transportation Technology category. The V2V Communications, Intelligent Transit, and Infotainment categories all have the highest average age at around 21 years. The V2V Communications category also has the highest median age at around 19 years. On the other hand, the Auto Ownership category is the youngest Transportation Technology category with an average age of around 5 years and a median age of around 4 years.

We are currently tracking 1181 Transportation Technology companies in 17 categories across 66 countries, with a total of $92.1 Billion in funding. Click here to learn more about the full Transportation Technology market report.
Transportation Technology Companies Founded by Year – Q3 2017

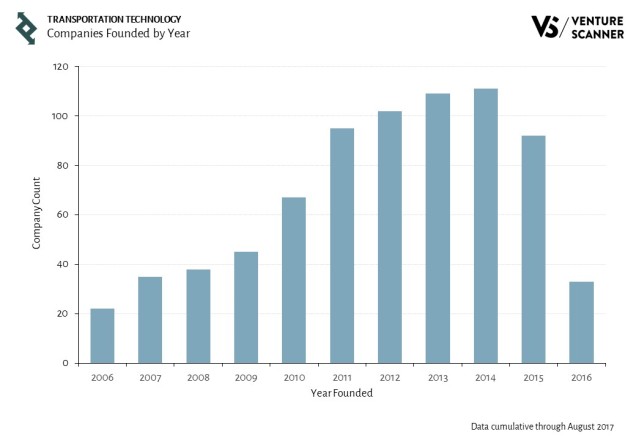
The following graph shows the founding year distribution in the Transportation Technology sector. The graphic includes data through August 2017.

Transportation Technology Companies Founded by Year

The above graph summarizes the number of Transportation Technology companies founded in a certain year. 2014 ranks at the top with 111 companies founded in that year. 2013 is the runner-up with 109 companies founded in that year.

We are currently tracking 1186 Transportation Technology companies in 17 categories across 66 countries, with a total of $94.4 Billion in funding. Click here to learn more about the full Transportation Technology market report.
Transportation Technology Funding Trends – Q3 2017

The following graphs highlight recent trends in Transportation Technology startup funding activity. The graphics include data through August 2017.

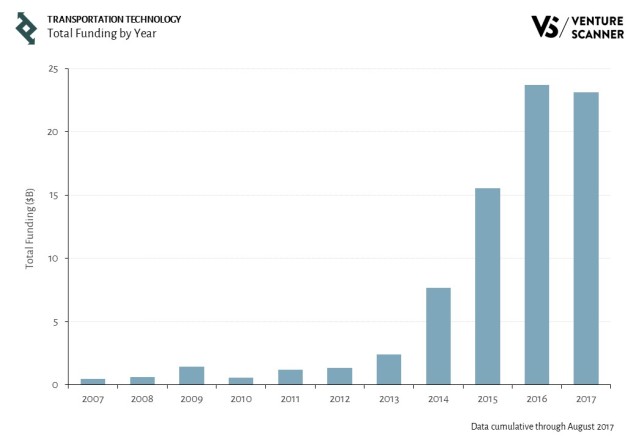
Transportation Technology Funding by Year

The above graph summarizes the total funding raised by Transportation Technology startups for each year. 2016 has the most funding to date at $24B.

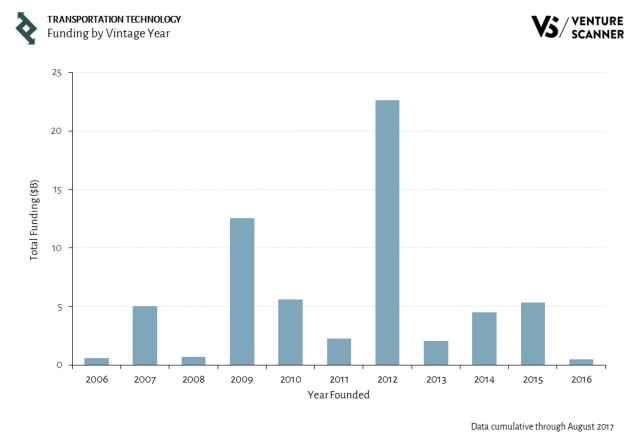
Transportation Technology Funding by Vintage Year

The above graph summarizes the total amount of funding raised by Transportation Technology companies founded in a certain year. Companies founded in 2012 have raised the most funding at over $23B.

We are currently tracking 1179 Transportation Technology companies in 17 categories across 66 countries, with a total of $92 Billion in funding. Click here to learn more about the full Transportation Technology market report.
Transportation Technology Funding by Round – Q3 2017

The following two graphs summarize the rounds of funding going into the Transportation Technology space. Please note these graphics are made using data through August 2017.

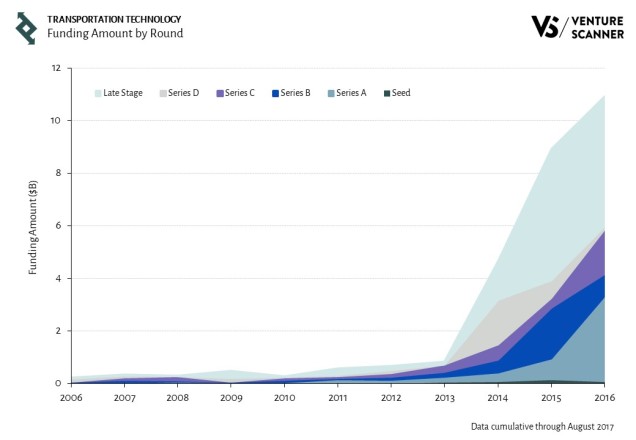
Transportation Technology Funding Amount by Round

The graph above shows the total amount of VC funding broken out by round. In recent years, we’ve seen a large increase in the amount of Series A and Late Stage funding events. The amount of Series D funding events has seen a large growth in 2014 and then quickly decreased.

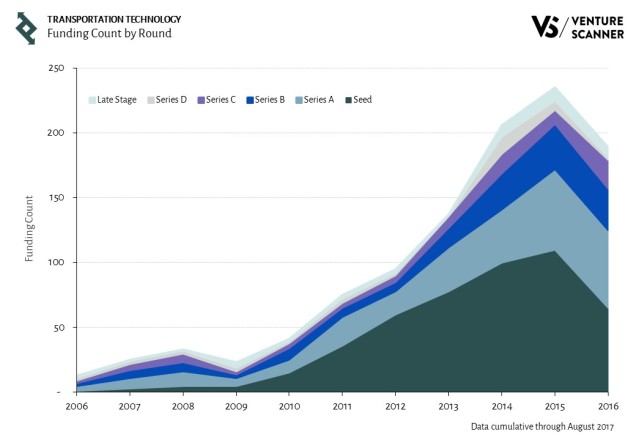
Transportation Technology Funding Count by Round

The graph above shows the total count of funding events broken out by round. Over the past few years we’ve seen a general upward trend that peaked in 2015 and dipped slightly in 2016. Earlier stage deals (Seed, Series A, Series B) have seen the largest growth in the number of funding events.

We are currently tracking 1174 Transportation Technology companies in 17 categories across 66 countries, with a total of $91.3 Billion in funding. Click here to learn more about the full Transportation Technology market report.
Transportation Technology Activity by Selected Investors – Q3 2017

The following graph summarizes investor activity in the Transportation Technology space. These graphics are made using data through August 2017.

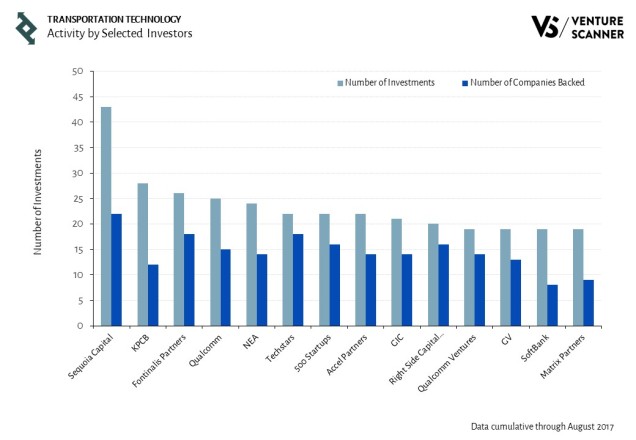
Transportation Technology Activity by Selected Investors

The above analysis summarizes the total number of investment rounds Transportation Technology investors participated in, and the number of unique companies funded by selected investors. Major investors include Sequoia Capital, Kleiner Perkins, Fontinalis, and Qualcomm.

We are currently tracking 1163 Transportation Technology companies in 12 categories across 66 countries, with a total of $88.4 Billion in funding. Click here to learn more about the full Connected Transportation market report.

Transportation Technology Exits by Category and by Year – Q3 2017

The following graphs highlight the exit activity in the Connected Transportation sector. The graphics include data through August 2017.

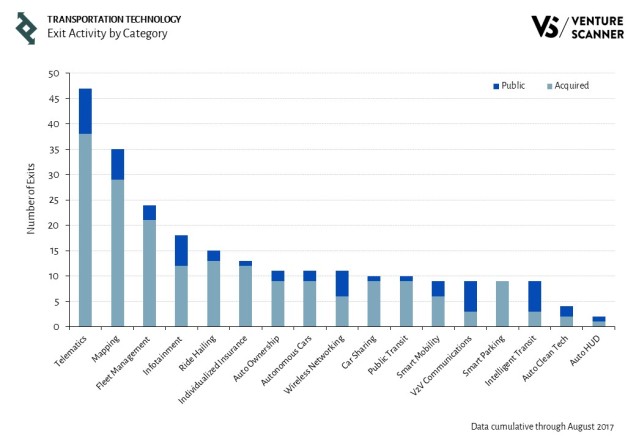
Transportation Technology Exit Activity by Category

The above graph summarizes the number of exits (acquisitions and IPOs) in each Transportation Technology category. The Telematics category is leading the sector with 38 acquisitions and 9 IPOs. The Mapping category is the runner-up with 29 acquisitions and 6 IPOs.

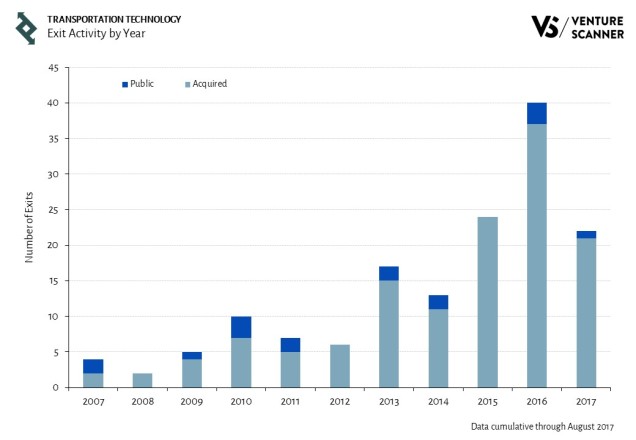
Transportation Technology Exit Activity by Year

The above graph summarizes the number of exits (acquisitions and IPOs) in Transportation Technology by year. 2016 leads the sector with 37 acquisitions and 3 IPOs, with 2015 in the second place with 24 acquisitions.

We are currently tracking 1157 Transportation Technology companies in 17 categories across 66 countries, with a total of $85.3 Billion in funding. Click here to learn more about the full Transportation Technology market report.
Average and Median Age by Transportation Technology Category – Q3 2017

The following graph shows average and median age in the Transportation Technology sector. The graphic includes data through May 2017.

Age by Transportation Technology Category

The above graph summarizes the average age and median age of companies in each Transportation Technology category. The Intelligent Transit Systems category has the highest average age at around 21 years, followed by the V2V Communications category and the Infotainment category with an average age of around 20 years each. V2V Communications category has the highest median age at 18 years, followed by the Infotainment category with a median age of 17 years.

We are currently tracking 1147 Transportation Technology companies in 17 categories across 66 countries, with a total of $77.6 Billion in funding. Click here to learn more about the full Transportation Technology market report.
Connected Transportation Companies Founded by Year – Q3 2017

The following graph shows the founding year distribution in the Connected Transportation sector. The graphic includes data through May 2017.

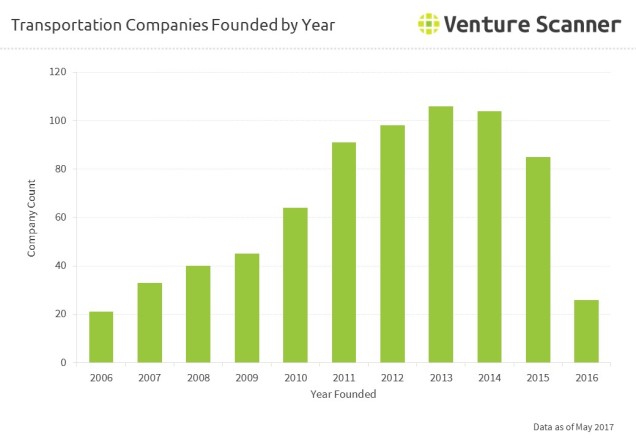
Connected Transportation Companies Founded by Year

The above graph summarizes the number of Connected Transportation companies founded in a certain year. 2013 ranks at the top with 106 companies founded in that year. 2014 is the runner-up with 104 companies founded in that year.

We are currently tracking 1141 Connected Transportation companies in 17 categories across 66 countries, with a total of $77.3 Billion in funding. Click here to learn more about the full Connected Transportation market report.

Connected Transportation Funding by Round – Q3 2017

The following two graphs summarize the rounds of funding going into the Connected Transportation space. Please note these graphics are made using data through May 2017.

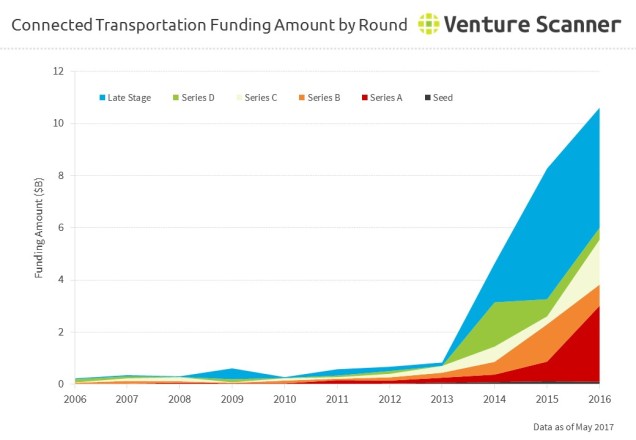
Connected Transportation Funding Amount by Round

The graph above shows the total amount of VC funding broken out by round. In recent years, we’ve seen a large increase in the amount of Series A and Late Stage funding events. The amount of Series D funding events has seen a large growth in 2014 and then quickly decreased.

Connected Transportation Funding Count by Round

The graph above shows the total count of funding events broken out by round. Over the past few years we’ve seen a general upward trend that peaked in 2015 and dipped slightly in 2016. Earlier stage deals (Seed, Series A, Series B) have seen the largest growth in the number of funding events.

We are currently tracking 1133 Connected Transportation companies in 17 categories across 66 countries, with a total of $73.6 Billion in funding. Click here to learn more about the full Connected Transportation market report.